In the previous post, we’ve learned what is symbolication process and why it is needed. In this post we will dive deeper and learn how to make sure a dSYM file is generated and see how we can manually use it to symbolicate crash reports.
How do I make sure dSYM is actually being generated?
XCode has several settings that may affect dSYM generation, let’s review them one by one.
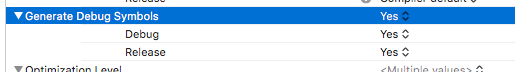
First of all, let’s make sure that debug information is being generated:
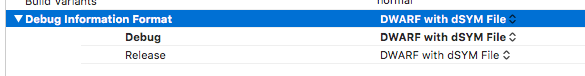
Let’s instruct XCode to put the debug symbols in a separate dSYM file:
By default that option is only selected for release builds, but not for debug builds. In most cases it is enough, as most commonly debug builds are only used by the developer while debugging their own application while being attached to XCode. However when trying out symbolication or when there is a chance a debug build is going to end up on a device of a colleague who is going to test it, we may still opt to have the dSYM file to be able to analyze the crashes.
And last, but not the least important:
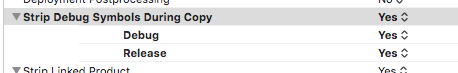
This option is not important for the symbolication process itself, but it is important to check it, as it instructs XCode to strip the debug symbols from the binary file itself, the file we are going to distribute to App Store. It both affects the size of the distributed application, but more importantly, leaving debug information in the application makes our competitors’ life much easier.
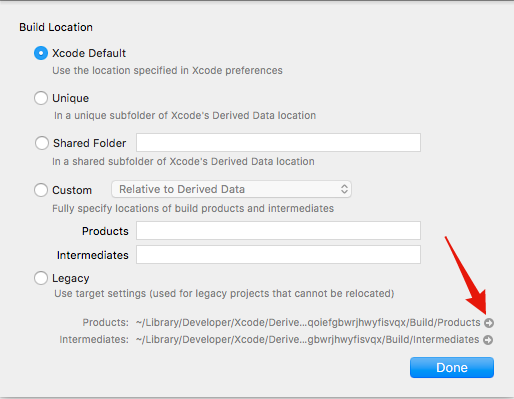
With all these options checked, our next build should produce a dSYM file (or rather a series of dSYM files, one for our main application and one for each framework we build as part of our application). The files are located in the products folder. Apple made it quite tricky to find it, one common method is to look at the build logs and copy the path from there. There is an alternative way through XCode:
- Go to File->Project settings
- Click on Advanced
- Clicking on that small arrow will reveal the product folder in Finder
Note: XCode 8.2 was used at the time of writing the post, the options may differ in other XCode versions.
What can I do with a crash report and a dSYM file?
Let’s say we have that raw crash report with addresses and a dSYM file that we know is the matching one. What can we do with it?
The address and the dSYM file should be enough to extract debug information about that address, but there is still one element missing. We need to know the exact address that image was loaded at for that specific crash. The reason for this is operating system randomizes the offset at which programs are being loaded every time they are ran. The technique is usually called ASLR (Address Space Layout Randomization) and it is mostly done for security reasons, as it prevents exploits that rely on a specific layout of the program at runtime.
This is where the list of all the loaded images comes into play. If you are dealing with raw crash reports generated by XCode, it can be found
in the “Binary images” section of the text file.
|
|
Now that we know that at that particular run our application has been loaded at 0x10007C000, we can use the atos tool that comes with XCode to try to extract more info:
|
|
That seems to be working. But that is a lot of tedious work if we do it manually. If we want to get nice human readable snapshot of the callstack, then for each address, we have to:
- Find the image that address is corresponding to in that particular run of the application (remember the ASLR?).
- Get the start address for that image
- Locate the dSYM file for that specific image. (Where do we get dSYM files for all the system images? *)
- Use atos tool to translate the address into a human readable location.
When you deal with XCode raw crash reports, there is a perl script that’s shipped in one of the frameworks that can partially automate this flow.
In XCode 8.2 it can be found in:
/Applications/Xcode.app/Contents/SharedFrameworks/DVTFoundation.framework/Versions/A/Resources/symbolicatecrash
but it may vary from version to version.
|
|
Now we can try to symbolicate the whole report at once:
|
|
- In fact, locating dSYM files for system frameworks is major pain point for most developers. These dSYM files are usually located in ~/Library/Developer/Xcode/iOS\ DeviceSupport/ folder. However this folder is populated by XCode and only contains symbols for iOS versions and architectures that were attached to that particular XCode. (i.e if you’ve never debugged an armv7 device running iOS 8.2 to your Mac, you will not have iOS 8.2 armv7 symbols on this machine.) Good news is starting with iOS 10, Apple dropped the support for all old armv7 devices, and both arm64 and armv7s support files are shipped with iOS regardless of the arch of the device itself. So it is enough now to attach any device with iOS 10.2 to XCode to have support files both for armv7s and arm64 flavors. It is still practically impossible to “collect them all”, however, especially when Apple sometimes releases iOS beta builds daily.
With this script in hand we know how to completely symbolicate one single crash. And that is assuming we got the crash report itself, all the dSYM files, all the tools and a lot of patience. In the real world however, this approach becomes impractical really quickly, as our app is deployed on thousands (hopefully millions!) of devices, all having different iOS versions and architectures. And in order to have a complete solution we have to:
- Have system frameworks dSYM files for all available iOS versions and architectures out there
- Be able to match and combine similar crashes, even if they have somewhat different stack traces, but share identical root cause
- Automatically catalogue dSYM files for each application and framework build we produce
- Detect, register and process every crash from every user and device
- Analyze app crash statistics and trends per device, iOS version, App version, etc.
That is exactly where 3rd party crash reporting services come into the picture. Crash reporting can do that and much more, leaving us time to focus on building the app itself instead of spending precious time on building infrastructure and toolchains for debugging and analysis. Crash reporting services differ when it comes to quality of the stack trace reports, as well additional contextual information they provide about the crashes. Bugsee crash reporting has recently been ranked the highest among all iOS crash reporting services when it comes to accuracy and the amount of details in the report. Bugsee doesn’t stop there, however, it also presents video of user actions, console logs and network traffic that preceded the crash.
In the next post of the series, we will be diving deeper into advanced topics of symbolication such as Bitcode.